Start with the evidence.
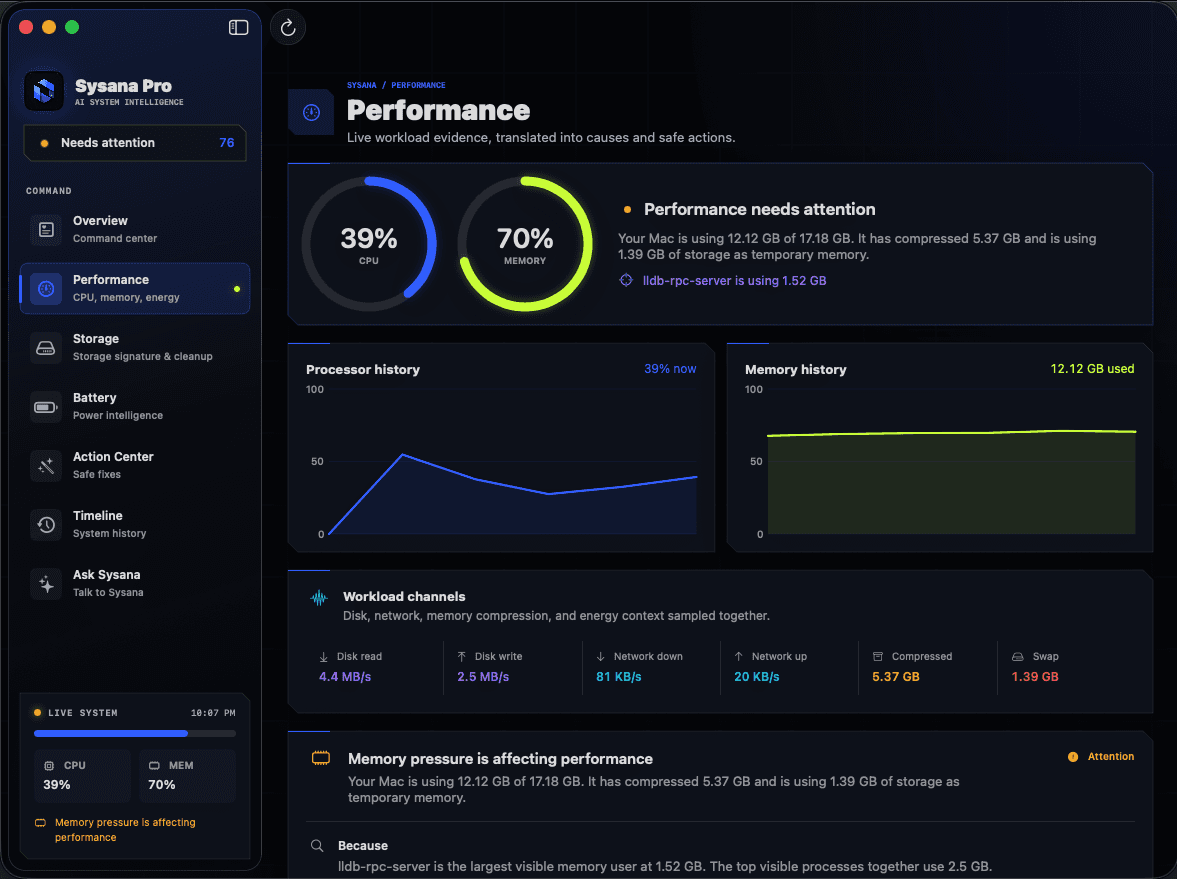
Memory Pressure is more useful than the amount of free RAM. Green means macOS is serving the workload efficiently; yellow suggests pressure is increasing; red indicates the workload needs more memory than is comfortably available. Swap is normal in moderation, but rising swap plus lag is worth investigating.
Why free memory is not the goal
macOS uses available memory for apps, recently used files, and caches because unused RAM provides no benefit. A Mac can show little free memory and still perform well. Memory Pressure combines available memory, compression, swap, wired memory, and other behavior into a more useful signal.
Look at the graph while the slowdown is happening. A green graph after the problem has passed does not explain the earlier event.
How to read Activity Monitor memory data
Open Activity Monitor, choose Memory, and use these signals together.
- Memory Pressure
Green generally indicates efficient use. Yellow means the system may be approaching a constraint. Red indicates that memory demand is affecting the system more seriously.
- Memory Used
This is the memory currently used by apps and macOS. A high value by itself is not proof of a problem.
- Compressed
macOS compresses inactive data to make room. Compression is expected; sustained growth combined with lag gives it more meaning.
- Swap Used
Swap moves some memory data to the startup disk. It can be normal, but heavy and increasing swap may make a constrained workload feel slower.
- Per-process memory
Sort by Memory and identify the apps using the most. Compare the number with what each app is doing, and watch whether it continues growing while idle.
What to do when pressure is yellow or red
Save your work and quit apps or browser tabs you do not need. If one app dominates memory, update it and test the same workflow after a restart. Repeated growth during a stable task may indicate an app-specific problem worth reporting to its developer.
Reduce simultaneous heavy workloads such as virtual machines, large creative projects, and hundreds of browser tabs. On Macs where memory is not upgradeable, the durable choices are a lighter workflow or hardware with more unified memory.
When memory is probably not the cause
If Memory Pressure stays green during the slowdown, check CPU use, disk activity, network delays, storage capacity, and temperature instead. A slow website, external drive, or cloud service can feel like a slow Mac even when local memory is healthy.
The best diagnosis matches the symptom, timing, and multiple signals—not whichever number looks largest.
Understand what your Mac is telling you.
Sysana connects performance, memory, storage, battery, energy, and thermal context in one clear diagnostic view. You review every recommendation.
Frequently asked questions
Is yellow memory pressure bad?
Yellow is a warning that memory demand is increasing, not proof of damage. Close unneeded work and watch whether pressure returns to green and responsiveness improves.
Is swap used on a Mac normal?
Yes. macOS may use swap as part of normal memory management. It becomes more relevant when it grows during your workload and appears together with yellow or red pressure and noticeable lag.
Should I use an app to clear RAM?
Usually no. Purging useful cached data can make apps reload work and does not add physical memory. Use Memory Pressure to identify whether there is a real constraint.